
How do we measure circularity? Part .2
How I talk about money when tackling circularity (no PhD in Mathematics needed)

Hey Sustainability Managers!
Last week we mapped the territory, ISO standards, engineering frameworks, the whole “biological vs. technical loops” vocabulary.
Useful stuff
But walk into a budget meeting with that language and watch your CFO check their phone within 90 seconds.
To actually move a circular project forward, you need to translate kilograms into cash. And I will be upfront about something before we get into the formulas: circularity is not automatically profitable. I have sat in meetings where teams (or sustainability person) had done genuinely impressive work: closed-loop pilots, supplier partnerships, the whole thing and the project still got killed because nobody had done the math clearly enough to defend it. Sometimes circular strategies are expensive, logistically painful and if the numbers don’t hold up, they become a slow way to burn budget while looking virtuous.
So here are the four formulas I actually use to figure out whether a circular strategy is a real business win or an expensive hobby and one real situation behind each of them
1. Recovery potential
A textile example

A client of mine (a mid-market sportswear brand) came to me convinced their take-back program was a sustainability win. They were collecting returned jackets, baling them and sending them to a fiber recycler. Felt good. But when we ran this formula together, the recovery potential was sitting at around 11%. Not because the recycler was bad, but because the jackets were made with a bonded shell: polyester laminated to a membrane that couldn’t be mechanically separated at scale. The recycler was essentially downcycling the whole thing into low-grade insulation fill, recovering maybe €0.30 per jacket against an original material cost of €2.70.
The program wasn’t circular. It was a slightly more expensive version of disposal, dressed up in a take-back label.
What changed the conversation wasn’t the sustainability argument, it was showing the product team that switching to a mechanically separable construction would push recovery potential above 40%, turning every returned jacket into €1.10 of avoided procurement per unit. At 50.000 returns per year, that’s a number the CFO actually wants to talk about. Design for disassembly stopped being an ideological ask and became a margin conversation.
2. When linear systems cost you
Packaging example
I worked with an e-commerce few months ago brand that was under pressure from their sustainability lead to switch their mailers from virgin plastic to recycled content. The sustainability argument was solid.
The procurement team’s pushback was also solid: recycled PE mailers were costing them roughly €0.08 more per unit and at 4 million mailers a year, that’s €320.000 in additional spend. Hard to approve without a strong counter-argument.
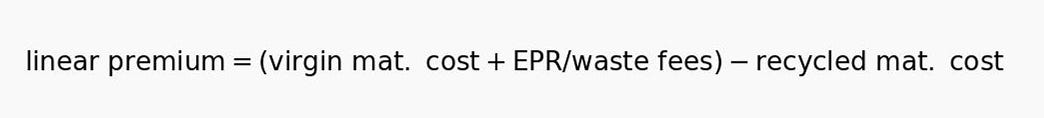
When we ran the linear premium calculation, the picture kinda changed. Their virgin PE cost was €1.40/kg. The EPR fees they were paying in the markets they sold into (France, Germany, Italy) averaged €0.52/kg on top of that. Recycled PE was coming in at €1.75kg.
The linear premium: (€1.40 + €0.52) − €1.75 = €0.17/kg in favor of recycled, once you factored in what they were already paying to offset the virgin material on the back end.
The per-unit cost premium evaporated. In fact, at their volume, they were leaving around €68,000 on the table annually by staying with virgin, just in EPR fees they could have avoided. The switch got approved in the next budget cycle, not because it was the right thing to do environmentally, but because the math finally made it the obvious thing to do financially.
3. Material productivity
An example with electronics

One of the more interesting projects I’ve been involved in was with a B2B electronics company selling industrial tablets to logistics operators (warehouses, distribution centers, that kind of environment). They were on a standard 3-year replacement cycle: sell, forget, let the customer deal with WEEE disposal. The average tablet weighed 620g and sold at €480.
We modeled what a leasing and certified refurbishment program would look like. Same tablet, but instead of a one-time sale, the company retains ownership, leases at €18/month per unit, takes it back after 36 months, refurbishes it to Grade A condition for around €40 and then releases it into a secondary market at €180 to smaller operators who can’t afford new.
Total lifetime revenue per unit: €648 from the lease plus €180 from resale, minus €40 refurbishment cost: call it €788 in recoverable value from a single device. Material productivity jumped from €774/kg in the linear model to €1.271/kg. That’s a 64% improvement in how hard each gram of material is working for the business.
The caveat I always give on this formula: it only holds if reverse logistics are disciplined. On that same project, the first pilot quarter showed collection costs running higher than forecast because the return rate was 67%, not the 85% we had modeled. The productivity numbers still held, but it was a reminder that the formula is only as good as the operational assumptions sitting underneath it.
4. Avoided procurement
Furniture example

This one came from a project with a contract furniture manufacturer, the type that supplies offices, hotels and co-working spaces. They had a significant volume of showroom and trade fair assets cycling through their operation every year: display chairs, tables, modular shelving systems used for a season and then retired. The default was to sell them off in bulk to a liquidator at near-zero value or donate them, and reorder fresh pieces for the next cycle.
When we mapped the actual flows, they were spending around €180.000 per year on new showroom furniture while simultaneously liquidating the previous season’s pieces for around €12.000. The refurbishment cost to bring the existing pieces back to showroom standard (reupholstering seats, touching up frames, replacing worn components) averaged 28% of the replacement cost.
Running the formula: €180.000 in new procurement versus €50.400 to refurbish what they already had. Circularity savings of €129.600 per year, essentially invisible until someone bothered to calculate it. No supplier negotiation, no new program, no sustainability initiative. Just a formal policy that refurbishment had to be costed and compared before any new purchase order above €500 could be approved.
It became the sustainability team’s easiest board slide. Not “we are reducing our environmental footprint”, though they were, but “we cut €129.600 from the procurement budget last year by keeping our own assets in circulation longer.”
In summary
What these four situations have in common is that none of them started as a financial conversation. They started as sustainability initiatives, design questions or procurement headaches and they stayed stuck until someone ran the numbers in a language that the business already understood.
Recovery potential, the linear premium, material productivity, avoided procurement. Four lenses on the same underlying question: is the material we’re already paying for working as hard as it could be?
None of these metrics hold up without reliable material flow data underneath them. If you don’t know what comes back, in what condition and at what rate, the formulas produce confident-sounding guesses. In other words, you can’t measure what you don’t know, which is a big limitations in using these frameworks.
Also, above I have presented mostly positive example, but we shouldn’t forget the negative either: sometimes the math doesn’t align with the expecations and those circularity initiatives aren’t simply profitable or even financially sustainable for a business.
See you then.
Gianluca
gianlucamanago.com
COMING UP NEXT WEEK

Next week, we open a new series: AI for sustainability work. We will start from the very beginning: what an ai agent actually is, how it thinks and why it matters for the kind of work you do every day. By the end of the series, you will have built your own agent from scratch and be ready to walk your team through it.
No coding background required.
Just curiosity and a dataset. See ya!
Appreciate your writing Gianluca. Clear and compelling 👏👍